Cluster Analysis
Cluster analysis is a statistical procedure to group respondents by similarity. Five survey questions were selected to group respondents into distinct COVID-19 personas.
- How important is it for youth sports facilities and tournament operators to enforce its COVID-19 guidelines and procedures? [Not at all important (1) to Extremely Important (5)]
- COVID-19 guidelines and procedures take away from the enjoyment of my experience at youth sports facilities and tournaments. [Strongly Disagree (1) to Strongly Agree (5)]
- COVID-19 is a major threat to public health [Strongly Disagree (1) to Strongly Agree (5)]
- A score from 1 to 9 was calculated based on the number of COVID-adaptations the respondent favored eliminating (1-9)
- When do you believe it is time to ”return to normal" without COVID-19 guidelines and restrictions? [We should have already returned to normal; Now; When mask mandates are lifted; When herd immunity is reached through vaccination]
Ordinarily, the standard k-means algorithm could be used with our variables, but due to our mixed data that included categorical and continuous responses, an algorithm was needed that could properly handle both quantitative and categorical data. Clustering algorithms measure the distance between feature vectors in order to separate groups of individuals, and calculating a distance between categorical variables is often tricky. Gower Distance allows the calculation of partial dissimilarities across various data types.
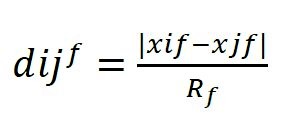
For quantitative features, the Gower Distance is measured as the absolute distance between two features and divided by the maximum range for all observations.
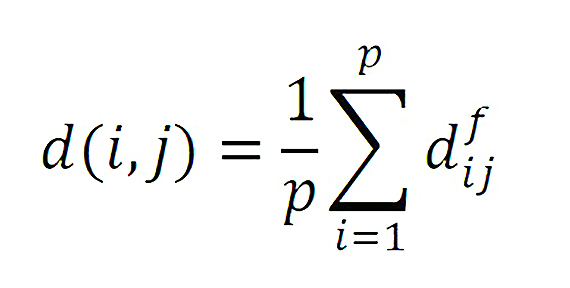
 For qualitative features, the partial dissimilarity is equal to 1 if the observations have the same categorical response, and 0 otherwise. Gower Distance then averages the quantitative and qualitative partial dissimilarities between two observations as the distance.
The selection for k, the number of clusters, is important in the methodological process because k represents how many different COVID-personas attained. The silhouette coefficient, an estimation of the consistency within clusters, was used to validate the choice of k. The coefficient “contrasts the average distance to elements in the same cluster with the average distance to elements in other clusters.” As a result, the k with the highest silhouette width is the best choice. The silhouette width presented an optimal value of k=2, but because a wider range of COVID-personas was more interpretable, the k with the second highest silhouette width, k=4, was chosen.
The clustering algorithm that performs well using Gower distance is Partitioning Around Medoids (PAM). While the k-means algorithm generally does not have actual data points as the medoid (center) of the clusters, PAM does have an actual data point as the centers. The PAM algorithm chooses k of the number of observations as the medoids. These medoids minimize the error of the algorithm and groups data points to which each medoid is the closest. Each non-medoid data point is compared to a medoid in terms of how it minimizes error, and if the non-medoid data point minimizes the error better than the existing medoid, the data point is swapped as the new cluster medoid. This iterative process continues until each data point is separated and grouped with its medoid that minimizes error.

